
Part 2: Hazard and Trend Analysis
Data is quickly becoming one of the most sought-after commodities for a variety of industries. In order to stay competitive, many companies collect data from customers, dealers, technicians, and resellers to assess how their product is doing in the field. With this overwhelming influx of information, how does one find value in this data? This is where Kinetic Metrics comes in!
What We Can Do
We look at data differently. We can first assess whether a data source is providing the appropriate level of integrity and utility to make informed decisions. For our automotive customers, we can provide an extra level of expertise. Given our past experiences as NHTSA investigators, we have the unique ability to analyze a manufacturers data with a similar insight as present day NHTSA. Observing potential trends helps us recommend the best way to handle a potential issue. In fact, we have recently worked on a pilot program with our partner Urvin called TRIP.
Our approach to hazard and trend analysis has the ability to apply to other industries. We have the ability to apply the same conceptual analysis to any data set.
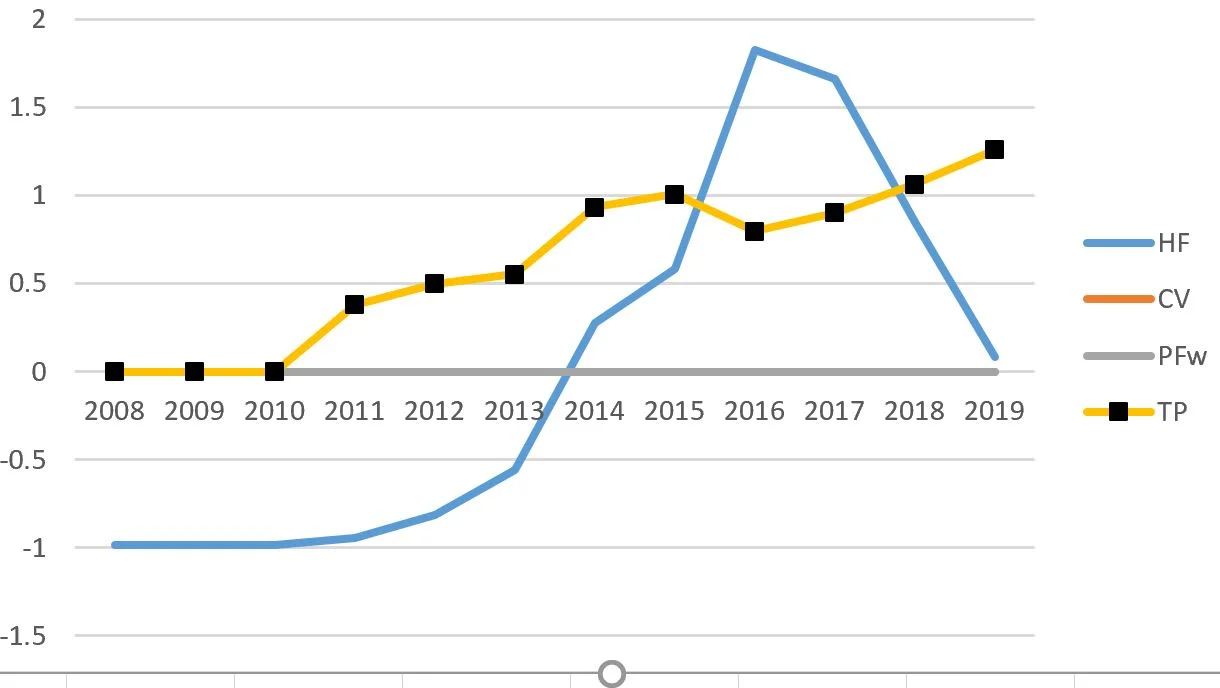
Example of Data Plot in TRIP Application
Who Can Benefit?
Anyone who is seeking more insightful and efficient ways to collect and analyze data.
Work Examples
EWR Data Sampling: We worked with manufacturers to analyze data they send to NHTSA per their Early Warning Reporting requirements. Kinetic Metrics reviewed all field reports, aggregate, and any other manufacturer supplied data. We looked at consumer complaints (VOQs) submitted to NHTSA and Technical Service Bulletins (TSBs). We also maintained a time series analysis based on NHTSA’s method to analyze aggregate warranty data it collects. All the collected data was screened for potential defect issues and any identified are given an overall risk ranking score based on the severity, detection and frequency of the issue. The risk ranking utilizes a scale that designates issues as either low, medium, or high risk. KM also searched for potential recall queries, either due to allegations of recurring failure after a recall fix was implemented or for vehicles not included in a recall action (scope expansion). All information found was submitted in a quarterly report, which is discussed with the client during a quarterly web conference. Contact us today if you are interested in these services.
Assessment of Data Utility: We conducted a special project for a client involving the assessment of a data’s utility, i.e., what was the overall value of the data collected. We reviewed over 1,500 data points and provided thorough analysis of how useful the data was and provided recommendations to improve upon the data sets for future use.
Example of Time Series Analysis Provided to Client